Organic Carbon Pool Exploration
DOC, A254, SUVA, S275-295
A principal component analysis (PCA) was does on normalized and scaled organic carbon parameters (Figure 10-12). Figure 10 shows a PCA performed on organic carbon parameters DOC, A254 (proxy for humic components), SUVA (proxy for aromaticity), and S275-S295 (proxy for low molecular weight) grouped by river sampled (Figure 10A), proximity to glacier (figure 10B), and month sampled (Figure 10C). Figure 10A shows high overlap between samples between rivers, suggesting that the river sampled might not impact the stream organic pool. Figure 10B shows a separation of samples collected at sites near glaciers (<7km) and far away from the glaciers (>35km), sites in between near and far sites share characteristics of both the near and far sites. Specifically, samples near to the glacier appear to have more glacial like characteristic in that they have lower molecular weight compounds (high S275-295 values), low amounts of organic carbon (low DOC), and low humic components (low A254) relative to samples far away from glaciers which have higher molecular weight compounds (low S275-295 values), high amounts of organic carbon (high DOC), and high humic components (high A254). This relationship appears to unrelated to month that the sample was collected (Figure 10B). Finally, figure 10C shows a separation of samples collected in the month of May compared to samples collected at other times. Specifically, samples from May have the highest amounts of organic carbon (high DOC), highest proportion of humic components (high A254), the highest proportions of high molecular weight compounds (low S275-295 values) and highest aromaticity (high SUVA) (Figure 10C), characteristics associated with terrestrial carbon pools in non-glacially fed streams. Overall, Figure 10 could indicate that the month sampled and proximity to glacier may lead to differences in the organic carbon pool, and that the river sampled may not lead to differences in the organic carbon pool.
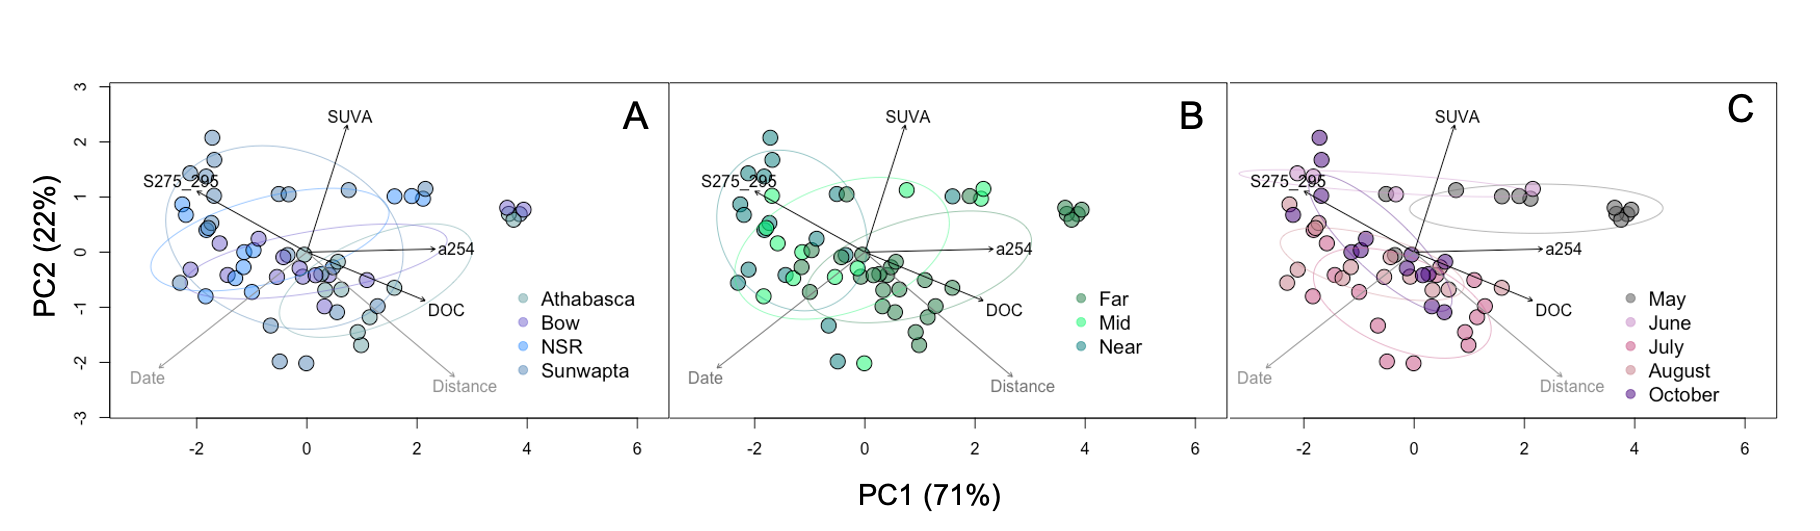
Figure 10: Principal component analysis representing cumulative sample variance of 93% ordinated using log normalized and scaled carbon parameters: DOC, a254 SUVA, and S275_295 (black vectors). Distance and Julian date (grey vectors) were fitted after rotation. Samples are circled with 60% confidence intervals colored by (A) river sampled, NSR = North Saskatchewan River, (B) distance range, near <7km, mid = 18-25km, far > 35km and (C) month sampled.
DOC, A254, S275-295, SUVA, d13C
Figure 11 shows three principal component analyses (PCA) conducted on normalized and scaled organic carbon parameters DOC, A254 (proxy for humic components), SUVA (proxy for aromaticity), and S275-S295 (proxy for low molecular weight), and d13C (terrestrial carbon tracer) grouped by river sampled (Figure 11A), proximity to glacier (figure 11B), and month sampled (Figure 11C). Overall, figure 11 shows that higher d13C values (more glacial like) are associated with later sampling dates, with increasing distance from glacier, high aromaticity (high SUVA) and a high proportion of humic components (high A254). Figure 11 also shows that d13C is unrelated to the amount of organic carbon (DOC) and the proportion of low molecular weight compounds (S275-295). Figure 11A shows separation between samples at different rivers, suggesting that the river sampled might be important to d13C values, with samples from the Bow river having higher values than those collected from the Athabasca, Sunwapta, or North Saskatchewan River (NSR). Figure 11B suggests that the proximity to glacier might be important to d13C value, with samples near to the glacier (<7km) having lower d13C values relative to sites far away from the glacier (>35km). Finally, figure 11C suggest that the month sampled could be important to d13C values. Specifically, samples from August have the lowest amounts of d13C, samples in October having the highest amounts of d13C (Figure 11C).
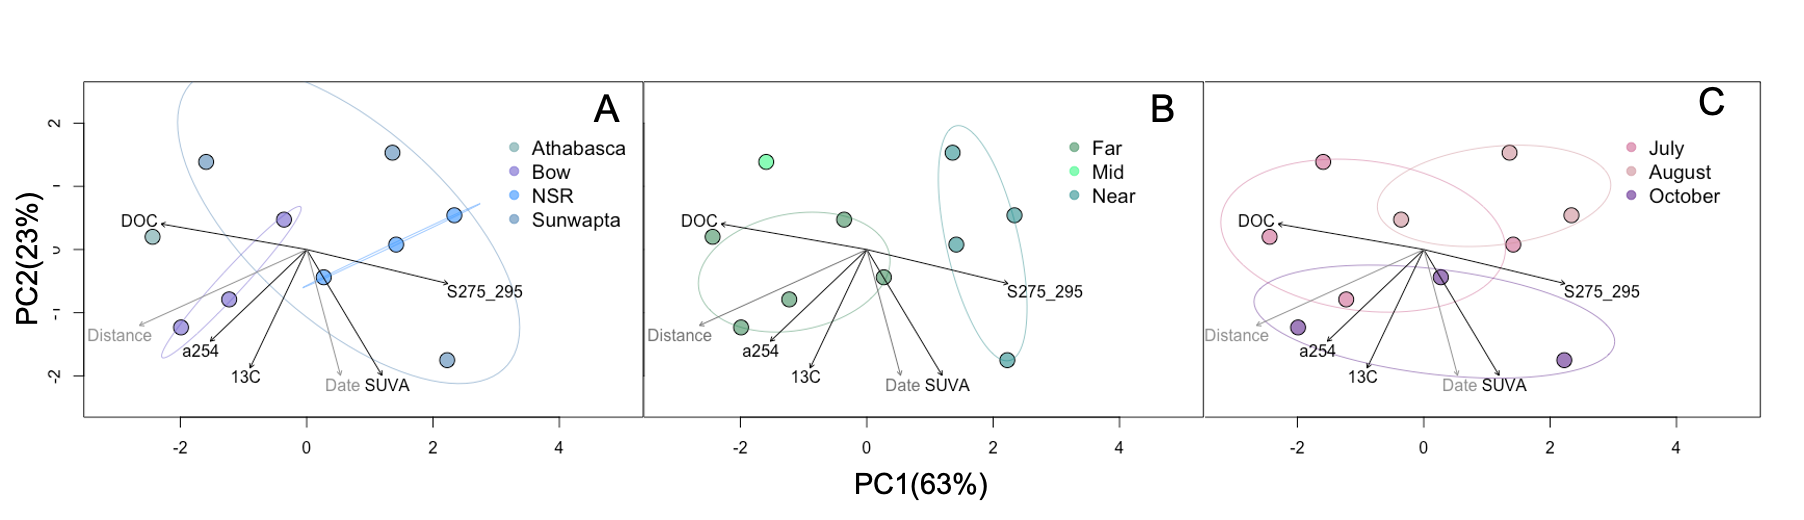
Figure 11: Principal component analysis representing cumulative sample variance of 86% ordinated using log normalized and scaled carbon parameters: DOC, a254 SUVA, S275_295 , and d13C (black vectors). Distance and Julian date (grey vectors) were fitted after rotation. Samples are circled with 60% confidence intervals colored by (A) river sampled, NSR = North Saskatchewan River (B) distance range, near <7km, mid = 18-25km, far > 35km and (C) month sampled
DOC, A254, S275-295, SUVA, d14C
Figure 12 shows three principal component analysis (PCA) conducted on normalized and scaled organic carbon parameters DOC, A254 (proxy for humic components), SUVA (proxy for aromaticity), and S275-S295 (proxy for low molecular weight), and d14C (proxy for carbon pool age) grouped by river sampled (Figure 12A), proximity to glacier (figure 12B), and month sampled (Figure 12C). Overall, figure 12 suggests that higher d14C (younger carbon pool) are associated with high amounts of carbon (high DOC), and samples taken earlier in the season, and not associated with proportion of humic components (A254) and proportion of low molecular weight compounds (S275-295). Figure 12A suggests that the river sampled might be potentially important to carbon pool age (d14C) with samples from the Sunwapta River having higher d14C (younger carbon pool) than the Bow River which has lower d14C (older carbon pool). Finally, Figure 12B and 12C suggest that proximity to glacier or the month sampled may not lead to variation in the organic carbon pool age (14C).
Figure 12 shows three principal component analysis (PCA) conducted on normalized and scaled organic carbon parameters DOC, A254 (proxy for humic components), SUVA (proxy for aromaticity), and S275-S295 (proxy for low molecular weight), and d14C (proxy for carbon pool age) grouped by river sampled (Figure 12A), proximity to glacier (figure 12B), and month sampled (Figure 12C). Overall, figure 12 suggests that higher d14C (younger carbon pool) are associated with high amounts of carbon (high DOC), and samples taken earlier in the season, and not associated with proportion of humic components (A254) and proportion of low molecular weight compounds (S275-295). Figure 12A suggests that the river sampled might be potentially important to carbon pool age (d14C) with samples from the Sunwapta River having higher d14C (younger carbon pool) than the Bow River which has lower d14C (older carbon pool). Finally, Figure 12B and 12C suggest that proximity to glacier or the month sampled may not lead to variation in the organic carbon pool age (14C).
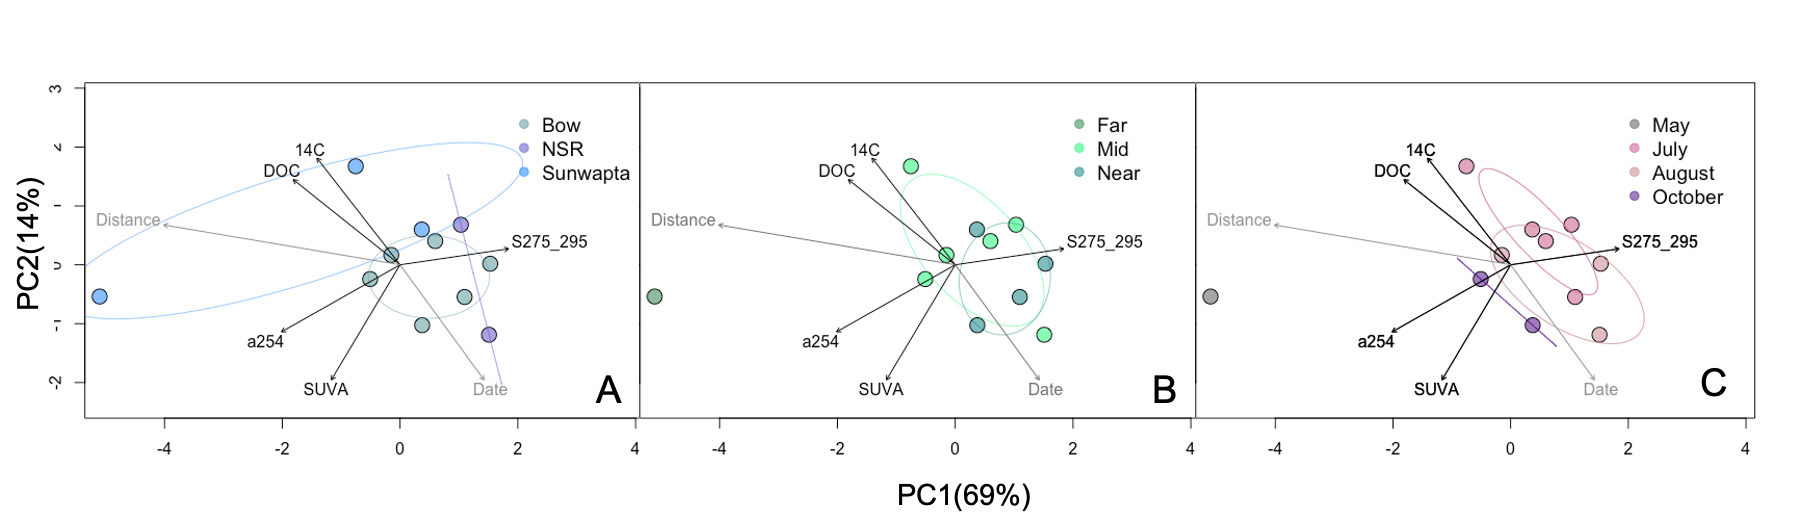
Figure 12: Principal component analysis representing cumulative sample variance of 83% ordinated using log normalized and scaled carbon parameters: DOC, a254 SUVA, S275_295 , and d14C (black vectors). Distance and Julian date (grey vectors) were fitted after rotation. Samples are circled with 60% confidence intervals colored by (A) river sampled NSR = North Saskatchewan River, (B) distance range, near <7km, mid = 18-25km, far > 35km and (C) month sampled
Microbial Community Exploration
Ordinations
An NMDS analysis was performed on Bray-Curtis distances of Hellinger transformed amplicon sequence variants (ASVs) of microbial samples (Figure 13). Colouring the NMDS points by proximity to glacial terminus suggest that distance from glacier may not be an important driver of microbial community variation since there is high overlap between sample points (Figure 13A). Colouring points by month collected indicates that season may lead to variation in microbial community composition, with microbial communities in May being distinct from microbial communities collected in July, August and October (Figure 13B). Finally, colouring points by river collected might suggest that there is variation in microbial community based on river, with samples from the Bow river separating out from samples collected from the Athabasca and Sunwapta River (Figure 13C). These initial ordinations might suggest that the river and time of the year the sample was collected from are important factors in structuring microbial communities, and that proximity to glaciers is not an important factor.
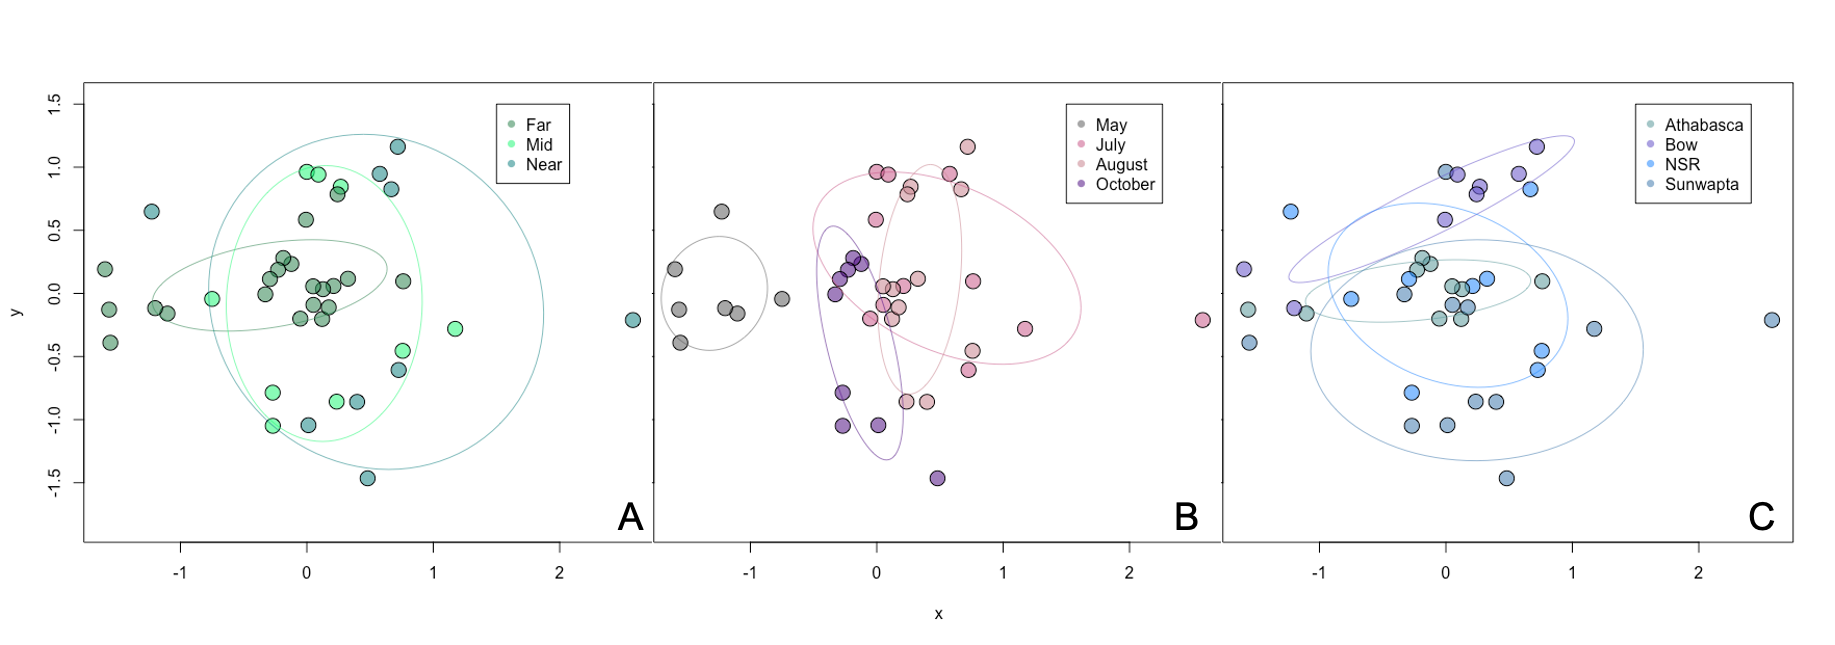
Figure 13: NMDS on a Bray-Curtis distance matrix of Hellinger transformed microbial species (ASV) data. Ellipses represent 60% confidence intervals colored by (A) proximity to glacier (near < 7km; 18km < mid < 25km; far > 35km), (B) month sampled and (C) river sampled (NSR = North Saskatchewan River)
