Objective 1: Investigate carbon pool characteristics in glacially fed streams
Multivariate Analysis
Discriminant analyses were conducted in order to investigate temporal and spatial trends in organic carbon characteristics (SUVA, A254, S275-295, DOC) (Figure 14). River sampled, month sampled and distance from glacier were all found to lead to significant variation in carbon pool characteristics (MANOVA, p < 0.05). Figure 14A shows the significant carbon parameters A254, SUVA, S275-295 and DOC that vary with month (ANOVA, p < 0.05). Discriminant analysis shows samples collected in May and June have relatively higher proportions of aromatic components (SUVA) then samples collected in the rest of the year (Figure 14A). River sampled was determined to lead to significant variation specifically in A254, DOC, and S275-295 (ANOVA, p < 0.05). Figure 14B suggests that the difference in organic carbon pools between rivers could be due to differences between samples collected from the Athabasca and the North Saskatchewan Rivers. Samples collected from the North Saskatchewan River appear to have a lower proportion of humic components (low A254), lower amounts of organic carbon (low DOC) and a high proportion of low molecular weight compounds (high S275-295) compared to samples collected from the Athabasca River. Finally, proximity to glacier was also determined to cause significant variation in A254 (proxy for humic components) (ANOVA, p < 0.05), DOC (ANOVA, p < 0.05), and S275-295 (proxy for low molecular weight compounds) (ANOVA, p < 0.05). Figure 14C demonstrates a general trend from moving from low molecular weight compounds (high S275-295), low humic components (low A254), and low concentrations (low DOC) to high molecular weight compounds (low S275-295), high humic components (high A254), and high concentrations (high DOC) with increasing distance from glacier.


Figure 14: Discriminant analysis performed on (A) log transformed and scaled organic carbon parameters by month (MANOVA ; p < 0.05), (B) log transformed and scaled organic carbon parameters by river (MANOVA ; p < 0.05), (C) log transformed and scaled organic carbon parameters by proximity to glacier (near <7km, mid = 18-25km, far > 35km) (MANOVA ; p < 0.05). Black vectors represent significant parameters (ANOVA, p <0.05).
Univariate Analysis
Univariate analysis was conducted as a follow up test to linear discriminant analysis and MANOVA to see how the organic carbon parameters each individually varied spatially and temporally. To examine temporal trends each organic carbon parameter (DOC, A254, S275-295, SUVA, d13C and d13C) were visualized as box plots organized by month sampled (Figure 15), river sampled (Figure 16) and proximity to glacier (near <7km, mid = 18-25km, far > 35km) (Figure 17)
Temporal Trends - Month: Samples collected in the month of May were determined to have significantly higher amounts of organic carbon than the rest of the months (Figure 15A), lower amounts of low molecular weight compounds (S275-295) and higher proportions of humic components (A254) relative to July, August and October (Figure 15C). Samples collected in the months of May and June were found to have higher amounts of aromatic compounds (SUVA) relative to other months (Figure 15D). Additionally, it was determined that samples collected in July and August had significantly depleted d13C values relative to samples collected in October. Finally, it was determined that the age of the organic carbon pool (d14C), did not significantly vary with month.

Figure 15: Box plots of unnormalized organic carbon parameters grouped by month and (A) DOC (ppm); (ANOVA, p < 0.05 ) (B) A254 (proxy for x); (ANOVA, p < 0.05) (C) S275-S295 (proxy for x); (ANOVA, p < 0.05) (D) SUVA (proxy for x); (ANOVA, p < 0.05) (E) d13C; (ANOVA, p < 0.05) and (F) d14C; not significant. Letters represent significant groupings (p < 0.05, holms-sidak adustment).
Spatial Trends - River: Amount of carbon (DOC), proportion of low molecular weight compounds (S275-295), proportion of humic components (A254) were all found to vary significantly with river (ANOVA, p < 0.05) (Figure 16). Proportion of aromatic components (SUVA), carbon pool age (d14C) and d13C were found to not vary significantly between rivers (Figure 16). The amount of organic carbon (DOC) was found to be significantly higher in the Athabasca compared to the North Saskatchewan River, and the Bow and Sunwapta River were not significantly different than any other River (Figure 16A). The proportion of humic components (A254) was found to be significantly higher in the Athabasca and Bow River relative to the Sunwapta and North Saskatchewan River (Figure 16B). The proportion of high molecular weight (low S275-S295) compounds was found to be highest in the Athabasca relative to the Sunwapta and North Saskatchewan River, with the Bow River not differing significantly from any other River (Figure 16C).

Figure 16: Box plots of unnormalized organic carbon parameters grouped by river and (A) DOC (ppm) (ANOVA, p < 0.05) (B) A254 (ANOVA, p < 0.05) (C) S275-S295 (ANOVA, p < 0.05) (D) SUVA (not significant) (E) d13C (not significant) and (F) d14C (not significant). Letters represent significant groupings (p < 0.05, holms-sidak adjustment). NSR = North Saskatchewan River
Spatial Trends - Distance from Glacier: Amount of carbon (DOC), proportion of low molecular weight compounds (S275-295), proportion of humic components (A254) were all found to vary significantly with distance away from glacier (ANOVA, p < 0.05) (Figure 17). Proportion of aromatic components (SUVA), carbon pool age (d14C) and d13C were found to not vary significantly with distance from glacier (Figure 17). The amount of organic carbon (DOC) (Figure 17A), and the proportion of humic components (A254) (Figure 17C) were all significantly higher at sites far away (>35km) from the glacier compared to sites near (<7km) glaciers. Additionally, sites located far away from glaciers had lower amounts of low molecular weight compounds than sites located near glaciers (Figure 17B).

Figure 17: Box plots of unnormalized organic carbon parameters grouped by proximity to glacier and (A) DOC (ppm) (ANOVA, p < 0.05), (B) A254 (ANOVA, p < 0.05) (C) S275-S295 (ANOVA, p < 0.05) (D) SUVA (not significant) (E) d13C (not significant) and (F) d14C; (not significant). Letters represent significant groupings (p < 0.05, holms sidak adjustment). Near <7km, mid = 18-25km, far > 35km
Do glacially fed streams have more glacial or terrestrial (non-glacial stream) characteristics?
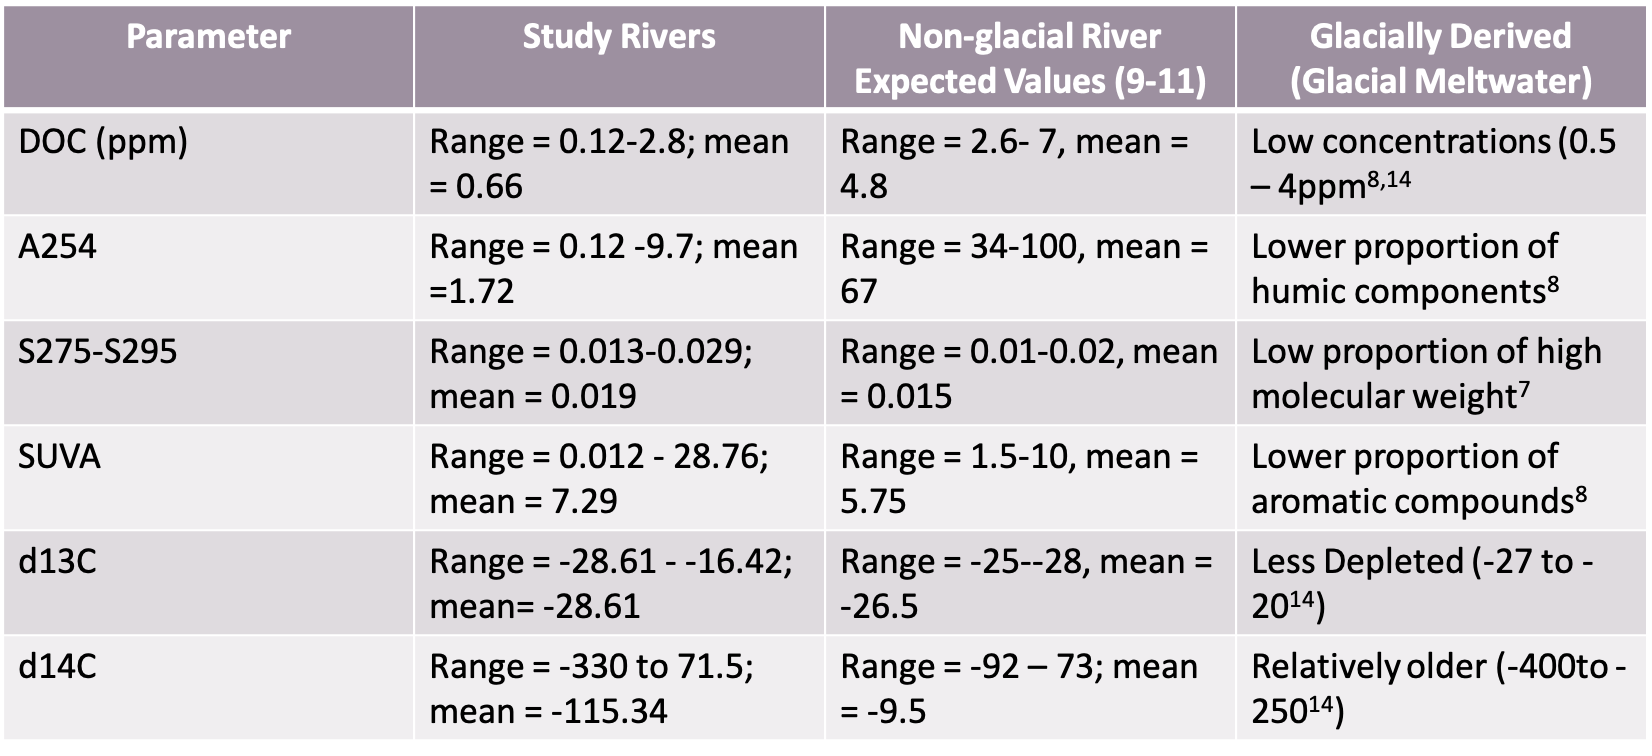
I hypothesized that organic carbon parameters would be within expected ranges compared to non-glacially fed rivers except during August (time of highest glacial input into stream) and at sites near glaciers (<10km). Table 5 shows that the mean amount of organic carbon (DOC), and the d14C values were lower in my study streams than what would be expected in a non-glacially fed stream. The DOC values were lower than studies characterizing glacial meltwater, and the radiocarbon age (d14C) was within the expected range based on other studies (Table 5). The proportion of humic components (mean A254) in my study streams were also on average lower than expected for non-glacially fed streams (Table 5). The amount of low molecular weight compounds and d13C values were within ranges found in non-glacially fed streams (Table 5). Finally, on average the amount of aromatic compounds within my samples were higher than what would be expected for a non-glacially fed stream. Overall, this indicates that on average my samples showed characteristics of terrestrially sourced carbon (amount of low molecular weight compounds, d13C values), and glacially sourced carbon (low amounts of carbon, low amount of humic components, and aged carbon pools), which was not what was hypothesized.
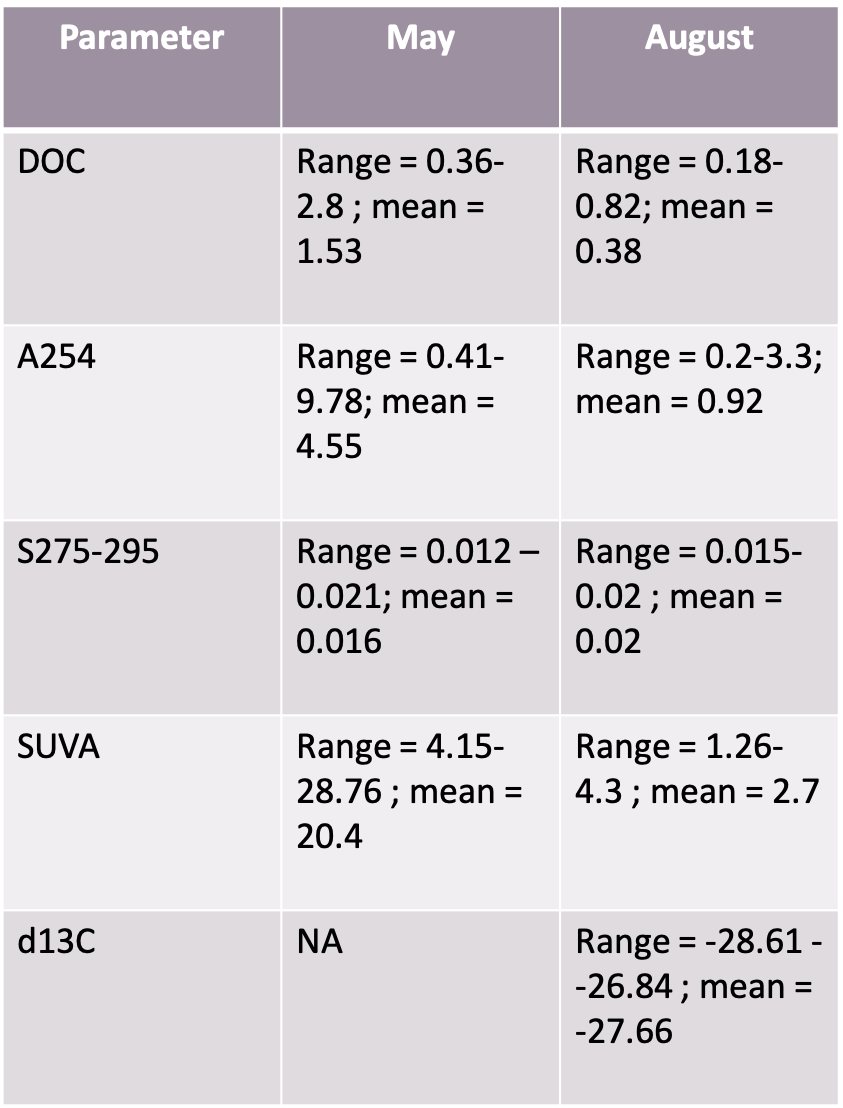
Table 6 shows the ranges of significant organic carbon parameters for sites sampled in the month of May (I hypothesized samples would appear most terrestrial) and the month of August (I hypothesized samples would appear most glacial). The average amount of DOC and amount of humic components (A254) in my study streams were still below what would be expected in a non-glacially fed stream in both the months May and August even though May had significantly higher DOC amounts than in August (Figure 16). The proportion of low molecular weight compounds (S275-295) was within expected non-glacial ranges for May but was higher than what would be expected for a terrestrial source in the month of August. This supports my expectation that samples taken in august will appear more glacial (since glacial carbon has relatively higher amounts of lower molecular compounds than terrestrial carbon) (Table 6). The amount of aromatic compounds (average SUVA) from samples in August match what would be expected for a terrestrial source, this goes against what was expected (Table 6). May indicates very high SUVA values, higher than what would be expected for a non-glacial stream which was also not expected. Finally, d13C was within non-glacial range for samples collected in August, which also goes against what was expected. In summary, there was a mixture of glacial and terrestrial carbon characteristics both in samples collected in May and August, which was not what was expected.
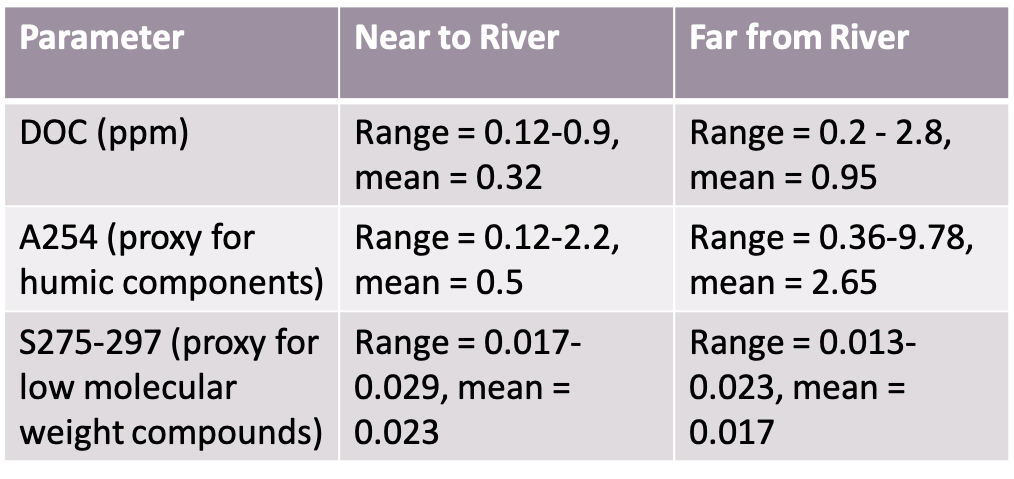
Table 7 shows the ranges of significant organic carbon parameters for sites sampled near to glaciers (I hypothesized samples would appear most glacial) and the month of August (I hypothesized samples would appear most terrestrial). The amount of organic carbon (DOC) and proportion of humic components (A254) were below expected ranges at sites both near and far away from glaciers. Finally, the proportion of low molecular weight compounds (S275-295) at sites near glaciers were above what would be expected in a non-glacial stream and was within range for sites far from glaciers. This is what was expected, since glacial samples have higher amounts of low molecular weight compounds than terrestrial carbon. Altogether, organic carbon characteristics for sites near glaciers appear more glacial than terrestrial which was what was expected. Organic carbon characteristics at sites far away from glaciers showed a mix of both terrestrial and glacial characteristics which was not expected.
I hypothesized that organic carbon parameters would be within expected ranges compared to non-glacially fed rivers except during August (time of highest glacial input into stream) and at sites near glaciers (<10km). Table 5 shows that the mean amount of organic carbon (DOC), and the d14C values were lower in my study streams than what would be expected in a non-glacially fed stream. The DOC values were lower than studies characterizing glacial meltwater, and the radiocarbon age (d14C) was within the expected range based on other studies (Table 5). The proportion of humic components (mean A254) in my study streams were also on average lower than expected for non-glacially fed streams (Table 5). The amount of low molecular weight compounds and d13C values were within ranges found in non-glacially fed streams (Table 5). Finally, on average the amount of aromatic compounds within my samples were higher than what would be expected for a non-glacially fed stream. Overall, this indicates that on average my samples showed characteristics of terrestrially sourced carbon (amount of low molecular weight compounds, d13C values), and glacially sourced carbon (low amounts of carbon, low amount of humic components, and aged carbon pools), which was not what was hypothesized.
Table 6 shows the ranges of significant organic carbon parameters for sites sampled in the month of May (I hypothesized samples would appear most terrestrial) and the month of August (I hypothesized samples would appear most glacial). The average amount of DOC and amount of humic components (A254) in my study streams were still below what would be expected in a non-glacially fed stream in both the months May and August even though May had significantly higher DOC amounts than in August (Figure 16). The proportion of low molecular weight compounds (S275-295) was within expected non-glacial ranges for May but was higher than what would be expected for a terrestrial source in the month of August. This supports my expectation that samples taken in august will appear more glacial (since glacial carbon has relatively higher amounts of lower molecular compounds than terrestrial carbon) (Table 6). The amount of aromatic compounds (average SUVA) from samples in August match what would be expected for a terrestrial source, this goes against what was expected (Table 6). May indicates very high SUVA values, higher than what would be expected for a non-glacial stream which was also not expected. Finally, d13C was within non-glacial range for samples collected in August, which also goes against what was expected. In summary, there was a mixture of glacial and terrestrial carbon characteristics both in samples collected in May and August, which was not what was expected.
Table 7 shows the ranges of significant organic carbon parameters for sites sampled near to glaciers (I hypothesized samples would appear most glacial) and the month of August (I hypothesized samples would appear most terrestrial). The amount of organic carbon (DOC) and proportion of humic components (A254) were below expected ranges at sites both near and far away from glaciers. Finally, the proportion of low molecular weight compounds (S275-295) at sites near glaciers were above what would be expected in a non-glacial stream and was within range for sites far from glaciers. This is what was expected, since glacial samples have higher amounts of low molecular weight compounds than terrestrial carbon. Altogether, organic carbon characteristics for sites near glaciers appear more glacial than terrestrial which was what was expected. Organic carbon characteristics at sites far away from glaciers showed a mix of both terrestrial and glacial characteristics which was not expected.
Table 5: Table comparing the mean values and ranges for organic carbon parameters collected from my study rivers (Bow River, North Saskatchewan River, Sunwapta River, and Athabasca River) to expected organic carbon ranges from non-glacially fed rivers.
|
Table 6: Table comparing the mean values and ranges for significant organic carbon parameters collected from my study rivers (Bow River, North Saskatchewan River, Sunwapta River, and Athabasca River) during May and October.
|
Table 7: Table comparing the mean values and ranges for significant organic carbon parameters collected from my study rivers (Bow River, North Saskatchewan River, Sunwapta River, and Athabasca River) from sites near to glaciers (<7km) and far from glaciers (>35km)
|
Objective 2: How do Microbial Communities Vary Spatially and Temporally?
My second objective was to investigate how microbial communities varied throughout the melt season, with increasing distance away from glaciers, and between different glacially fed rivers. The purpose of this objective was to help inform the experimental design for the 2021 incubation experiment. It was hypothesized that if there were significant with variations in the stream organic carbon pool to season, proximity to glacier, and between rivers that there would also be significant variations in microbial community structuring. In order to investigate this, I performed an NMDS ordination on a Bray Curtis distance matrix of Hellinger transformed microbial community data (Figure 18).

Figure 18: NMDS performed on Hellinger transformed ASV counts by month by (A) proximity to glacier (perMANOVA, p < 0.05), (B) month (perMANOVA, p < 0.05, and (C) river (perMANOVA, p < 0.05). Ellipses represent 60% confidence intervals. Stress: 0.14
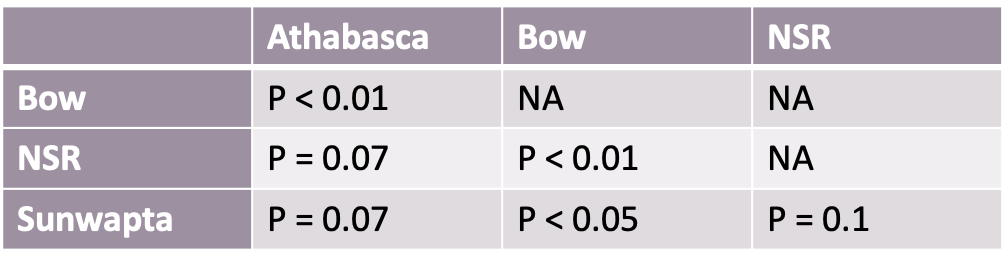
It was found that microbial community structure significantly varied depending on the month sampled, proximity to glacier and between rivers (perMANOVA, p < 0.05) (Figure 18). It was determined that the microbial in communities in May and October were significantly different then each other as well as all other sampling months (Table 8). Additionally, it was determined that microbial communities in July and August did not significantly vary from one another (Table 8). Proximity to glacier was also found to lead to significant variation in microbial communities, with samples collected far away (>35km) being significantly different than samples collected near (<7km) and at mid (15km-25km) distances, with there being no differences in microbial communities located between 0-25km away from glaciers (Table 9). Finally, the river that the sample was collected from also led to variation in microbial community (Figure 18C). Samples collected from the Bow River were significantly different than those collected at the Sunwapta River, North Saskatchewan River and the Athabasca River (table 10). Communities from the Sunwapta River, North Saskatchewan River and the Athabasca River were not shown to be significantly different (Table 10).
In summary, microbial communities were found to significantly vary temporally and spatially which was expected since carbon pools also vary temporally and spatially. Microbial communities were significantly different in May and at sites located near and far from glaciers. These trends were also observed in carbon pool characteristics (Figure 14) which was expected. However, carbon pools were shown to be significantly different between Athabasca and Sunwapta River (Figure 16) but the microbial communities between these rivers were significantly no different which was not expected (Table 10). This could indicate that microbial communities and carbon pool do not always vary together, against what I hypothesized. Whether organic carbon characteristics drive variation in stream microbial communities will be investigated in objective three.
The results from these analyses will be utilized to inform the experimental design for the 2021 incubation experiment (to test if microbial communities preferentially assimilate glacial carbon over terrestrial carbon). These results suggest that depending on what season the microbial communities are collected for the 2021 incubation experiment, there could be different results, as there are significant differences between microbial communities from May, to July/August, and October. To compare how microbial communities at, and downstream from glaciers process organic carbon a site located either at a near or mid distance range (0-25km) should be compared to a site farther downstream (>35km) based on significant differences between those communities.
Table 8: Table showing significance between microbial community variation based on month sampled using pairwise perMANOVA (p adjustment method = Holms)
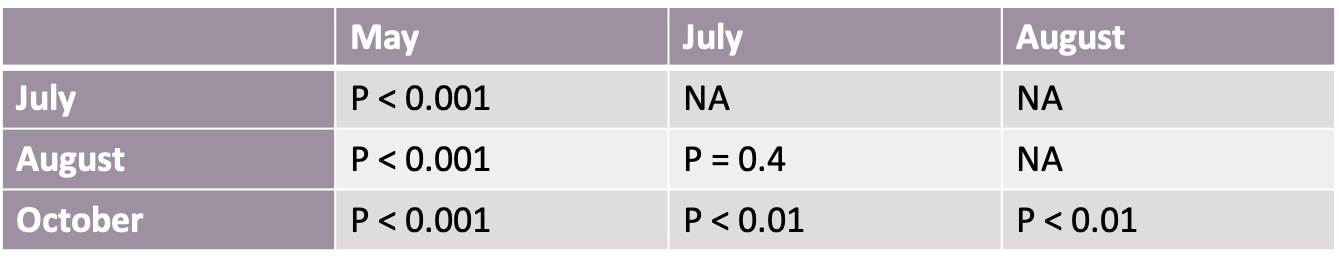
Table 9: Table showing significance between microbial community variation based on proximity to glacier using pairwise perMANOVA (p adjustment method = Holms). near (<7km) mid (18km<site<25km) far (>35km)
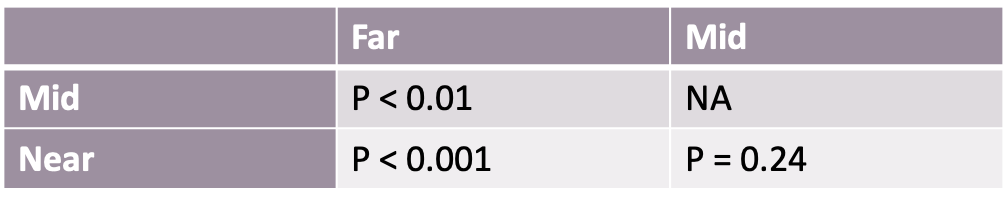
Table 10: Table showing significance between microbial community variation based on river sampled using pairwise perMANOVA (p adjustment method = Holms). NSR = North Saskatchewan River
Objective 3: Are properties of the organic carbon pool creating variation in microbial communities?
My third objective was to investigate if organic carbon characteristics led to variation in the structure of stream microbial communities. It was hypothesized that since organic carbon is essential to microbial function, that differences in organic carbon pool properties would lead to differences in the structuring of microbial communities. In order to achieve this a distance-based redundancy analysis was performed on a Bray Curtis distance matrix of Hellinger transformed microbial community data and normalized and scaled organic carbon parameters as well as month sampled, proximity to glacier, and river sampled. Sampling information was added to see how potential organic carbon variation compared to season, distance and river sampled. It was determined that month sampled accounted for 12% of the variation between communities, river sampled accounted for 10% of the variation between communities, and proximity to glacier accounted for 6% of the variation between communities (Table 11). Organic carbon characteristics (DOC, S275-295, A254, SUVA) were not found to cause significant variation in microbial communities. This result was not what was expected and could indicate that organic carbon characteristics are not important in microbial community structuring. However, this result should be interpreted with caution as it only includes absorbance characteristics of the organic carbon pool, which cannot capture the complete diversity of molecules within the organic carbon pool. Additionally, the residual for the distance-based redundancy analysis was 61.5%. This suggests the majority of variation in microbial communities could not be determined based on parameters that were collected in the project. Future research for this project should include parameters that may be more important to microbial community structuring such as stream nutrient concentrations, water flow, and temperature.
Table 11: The output of a distance based redundancy analysis on a Bray Curtis distance matrix of hellinger transformed microbial community data and normalized scaled organic carbon parameters and sampling information. Significance determined by ANOVA.

